Common causes, practical diagnostics, and finding root causes
If you’ve spent any time in IT, you’ve likely seen antivirus or EDR software impact workstation performance. Microsoft Defender for Endpoint is no exception.
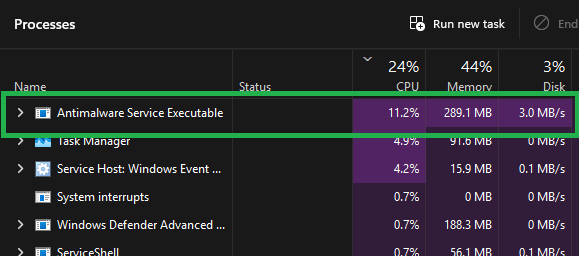
High CPU usage attributed to Microsoft Defender Antivirus (often showing up as Anti Malware Executable) can be frustrating to troubleshoot and it is one of those issues that can feel very mysterious. Everything seems “normal,” and then suddenly endpoints slow down and application performance suffers causing a terrible end user experience.
More so, troubleshooting, diagnosing, and finding repeatable ways to identify what’s really happening can be tricky even for seasoned I.T. administrators.
In this post, I discuss real-world causes and different troubleshooting approaches to help admins uncover high CPU usage in Defender for Endpoint.
Why Defender CPU Spikes Happen
Defender’s job is to inspect activity as it occurs such as opening a file, downloads, process launches, script execution, and memory behavior. CPU spikes are often the byproduct of how much scrutiny Defender needs for a given workload.
Trust Issues: Unsigned or “Untrusted” Components
One of the most common performance triggers occurs when an application, or the components it loads is not fully trusted.
Even if an executable is signed, it can still load unsigned dependencies. For example, Microsoft Excel is a trusted, signed application, but an end user may install a third‑party add-in that includes unsigned DLLs. When this happens, Microsoft Defender for Endpoint may perform real‑time scanning each time Excel is launched or actively used.
Trust can also be reduced by issues such as missing certificate chains, expired certificates, or problems with CRL or OCSP verification. When these trust signals are incomplete or unavailable, Defender is more likely to perform deeper inspection.
Why this matters: Trust directly influences scan behavior. Strong trust signals typically result in lighter scanning, while reduced trust increases scan depth and with it, the potential for performance impact.
Complex File Formats and “Unusual Usage”
Certain file types inherently require more analysis, especially when they are used in ways they were not originally designed for.
For example, HTA files are sometimes repurposed as “database‑like” storage, even though they are meant for scripting and automation. Similarly, large structured files that must be deeply parsed and inspected can significantly increase scanning effort.
Practical tip: If a file type is being used as a database, move that workload to a proper database platform. This allows Microsoft Defender to perform less intensive scanning, which often results in noticeable performance improvements.
Obfuscated Scripts
When Defender encounters heavily obfuscated code, it responds by performing deeper inspection to determine intent, including in-memory analysis to answer the question: “What is this script actually doing?”
This additional scrutiny can introduce noticeable performance overhead, particularly in environments that rely heavily on PowerShell automation. Unsigned PowerShell scripts and repeated execution patterns such as looping or short interval triggers can increase Defender scrutiny and increase scan durations.
Configuration Issues That Commonly Hit Hard
Nonpersistent VDI Image Sealed Too Early
In nonpersistent VDI environments, it is important to allow Defender to build its performance cache (including file hash cache) to avoid re-scanning everything.
If the image is sealed before cache maintenance finishes, every new VM launch repeats expensive caching/scanning work.
Fix: Allow cache maintenance to complete before sealing the golden image.
“Fat-fingered” Path Exclusions
Misconfigured exclusions can also unintentionally add overhead. For example, excluded paths that don’t exist can cause extra search behavior because Defender will scan all paths in attempt to find the exclusion.
Tip: Be sure to validate exclusions and confirm they’re correct and necessary.
Knowing Which Scan Type Is Driving CPU
Defender can be “busy” for different reasons. Therefore, it helps to determine what kind of scan is causing the load:
- Real-time protection: scanning during file open/download/execute
- Scheduled scans: quick scans daily, full scans weekly (or configured otherwise)
- Catch-up scans: triggered after two missed scheduled scans (common on laptops that sleep/hibernate)
- On-demand scans: SOC analysts or users initiate scans
- Process scan after security intelligence update: can resemble a quick scan
Operational tip: Be sure to schedule scans at times that reduce end-user impact (e.g., full scans after work hours, quick scans during low-activity windows such as typical lunch times).
Practical Troubleshooting: Tools That Help
Traditional tools are powerful, but not always easy:
- Sysinternals Process Monitor (ProcMon): easier entry, great for I/O visibility, but not always intuitive as to what is causing Defender usage to spike.
- Windows Performance Recorder (WPR): extremely powerful, but advanced learning curve
To simplify Defender-specific performance troubleshooting, Microsoft provides a built-in tool, the Microsoft Defender Antivirus Performance Analyzer
This is shipped with Defender and helps you capture and analyze performance traces quickly, without installing extra tooling.
Example Workflow Using MDAV Performance Analyzer: Capture + Analyze
To better understand how to use this tool, I will go through a sample scenario that demonstrates how to capture and read the performance traces. I have also made the scripts used in this example available in the following GitHub repo.
Record performance data (ETL trace)
To start a capture use the built-in PowerShell cmdlet and record for 3-5 minutes
New-MpPerformanceRecording -RecordTo recording.etl 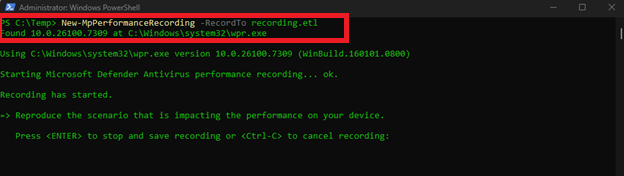
Analyze the scan results
Once the recording is complete, the first command I like to run is this:
Get-MpPerformanceReport -Path C:\Temp\recording.etl -TopProcesses 3 This allows me to see which process may be causing scans and impacting scan duration.
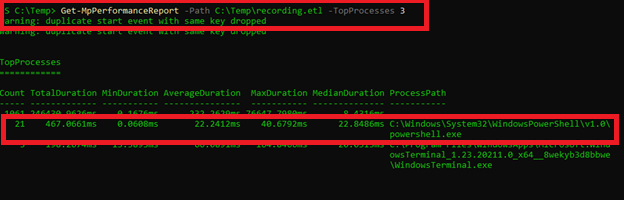
As we can see in my example, powershell.exe has multiple hit counts and a noticeable scan time despite PowerShell being a trusted application. However, this information alone is usually not enough to fully understand what is going on.
So, the next command I like to run is the following:
Get-MpPerformanceReport -Path C:\Temp\recording.etl -TopScans 3 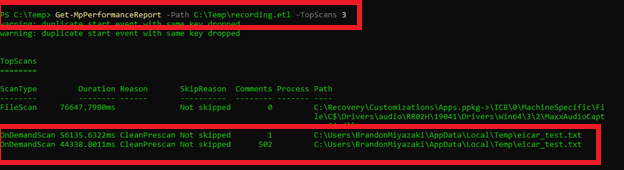
Here we can see a few scans that stand out especially because of the reason for the scan and the file path accessed.
For additional details I will use the -TopPaths settings to determine if there is a hot path that needs investigating or unusual file or directory activity.
Get-MpPerformanceReport -Path C:\Temp\recording.etl -TopPaths 3 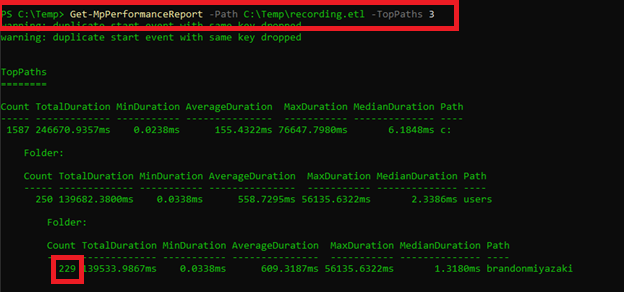
Looking at these results, the paths being used do not appear out of the ordinary. However, the total count is particularly high which would indicate that there may be something related to my user folder which is triggering a high volume of scans.
The next command I will run is:
Get-MpPerformanceReport -Path C:\Temp\recording.etl -TopProcesses 5 -TopFilesPerProcess 5 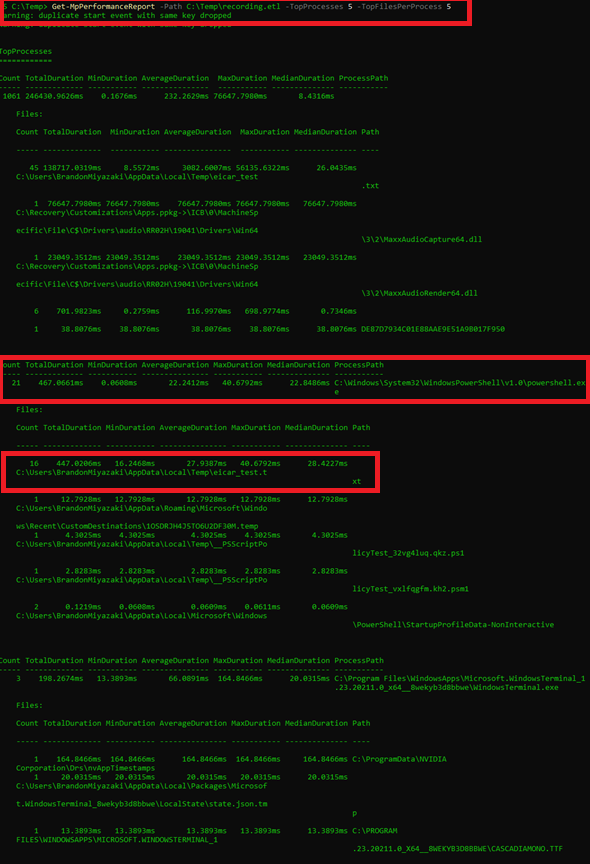
This command allows us to see the top processes and files or paths related to those processes. Analyzing the output we can see that the top process of powershell.exe is tied to file the file eicar_test.txt which is located in the Temp folder of my user AppData folder.
Finally, the last command I will run is:
Get-MpPerformanceReport -Path C:\Temp\recording.etl -Overview 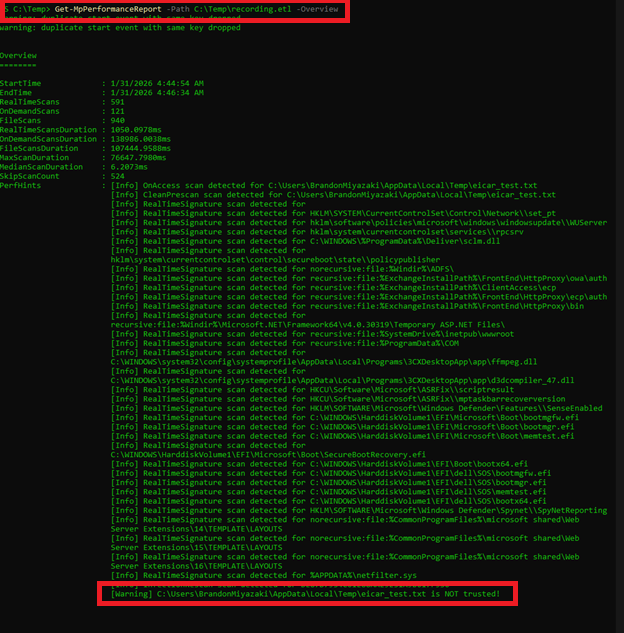
This output provides us with a complete rundown of the scan process including the different types of scans triggered and why action was taken. As we can see in the highlighted field, the file named eicar_test.txt is “NOT trusted!” by Defender.
With this performance data and correlation output in hand, we can now move beyond surface-level symptoms and begin making informed, evidence-based troubleshooting decisions. Instead of simply observing high CPU utilization from Microsoft Defender, we can use these insights to guide deeper investigation on the local system and understand why the specific process, powershell.exe is repeatedly accessing the file eicar_test.txt.
In this example scenario, high CPU utilization was intentionally triggered to simulate a real-world performance issue. I created the PowerShell script with a looping function that continuously downloads the EICAR test file. The EICAR file is a widely accepted, safe test artifact designed to validate antivirus and EDR solutions without introducing real malware into the environment. Because Defender recognizes this file as a known malicious test signature, each download event immediately triggers scanning, reputation checks, and behavioral analysis.
While this is a controlled scenario, it allows us to clearly observe how Defender responds to specific activities on a device and these actions surface within the MDAV Performance Analyzer. By demonstrating this workflow, I hope you can learn how to isolate variables, measure impact, and validate a repeatable method to troubleshooting Defender performance issues.
Final Thoughts
If there is one thing to remember, it is that Defender performance troubleshooting is about understanding behavior, not just watching CPU metrics.
Trust directly affects performance. Unsigned or untrusted modules trigger deeper inspection, while brief CPU spikes are normal and expected. Sustained utilization, however, signals the need for investigation.
VDI image sealing timing is also critical. Allowing Defender caching to complete before sealing golden images prevents repeated scanning overhead. It is equally important to verify the scan type, since scheduled, on-demand, catch-up, and real-time scans can appear similar, but behave very differently.
Using the right tools matters. The Defender Performance Analyzer provides additionally visibility into scan activity and dramatically simplifies root cause analysis. Broad exclusions should always be avoided when possible, especially for high-activity paths such as temporary folders.
Ultimately, Defender scans can be triggered by many factors, from unsigned application plug-ins to suspicious driver behavior. Regardless of the cause, the ability to identify root cause is what turns Defender performance issues from frustrating mysteries into solvable problems.
Until next time!